
The question is, what’s the best way to look at a team’s performance on the whole? We basically have three important units by which we measure a football squad. The first – and most ultimately important – is the scoreboard. The second is yards, either yards given up by the defense or yards claimed by the offense. And the third is turnovers. Being an engineer and seeing three units, my impulse is to combine the three into some useful metric. According to this article at Sports Quant, fumbles and interceptions both result in about the same amount of lost points or yards. Smart Football reader Brad Eccles makes the case that fifty yards is a statistically-reasonable penalty for either a fumble or interception – that is, if you fumble, subtract fifty from your offensive yardage total. I’ve also seen (though I can not remember where, so let me know if you run across that number or a better one) that fifty yards is an appropriate bonus for plays that result in a touchdown. This seems about right to me. Thus, we can convert turnovers and touchdowns into yards and express a team’s production using a single unit. Moreover, what’s good for me is bad for my opponent and vice-versa: penalties against Auburn should be recorded as negative yards, and penalties against opponents as positive yards.
This includes the offense and the defense: the offense’s forward progress can be expressed as positive yardage, and the defense’s as negative yardage. As we learned last year, the offense and defense are not distinct.
I’ve borrowed another idea from Smart Football. There, he describes a method of evaluating a play’s success called the Sharpe Ratio. Now, I have my own issues with the Sharpe ratio – dividing by standard deviation is not a good idea when, in particular, most running backs’ success depends on their big-play potential. However, one important thing contained in that statistic is the evaluation of a play in comparison to its risk. We could theoretically run a short screen, a slant, or a quarterback draw every single play and gain a dependable, undefendable two yards every single time. While this would not be an effective strategy, all plays must be evaluated against this standard. For instance, an incomplete pass is essentially two yards given up forever. Thus, the yardage that results from each play is adjusted down by two.
I usually make some judgment about what constitutes “garbage time” and ignore that yardage. If one team is clearly bleeding clock, they’ve essentially stopped running their offense and it shouldn’t count. Also, I ignore what I consider to be uncoachable plays or dumb luck, like interceptions returned for touchdowns – these don’t count as an interception and a touchdown, just as one or the other. If the defense gets the ball, they’ve won and a win is worth fifty. Same thing for special teams touchdowns.
By this method, we can chart out our team’s progress over the entire game, in both phases of the game, as a single function. This is just what I’ve done. I copy the play-by-play at ESPN.com (more reliable than Rivals) into a text file, import that text file into a spreadsheet, and use the wonders of MS Excel to semi-automatically create a running list of the plays that are run, the players who run them, the down, the distance, the location and the result. Then, once I have an adjusted yardage for each play, I graph a running sum of offensive and defensive yards – this is essentially a running, risk-adjusted yardage differential. It gives some idea of the arc and flow of the game, and unites the offense’s and defense’s statistics. The goal, obviously, is to be in the positive by the last whistle. Granted, this does not reliably correlate with a team winning the game – field goals, defensive touchdowns, and special teams touchdowns are not included. But that’s not the point – I just want to see which team is most effective when they get down to work.
(I originally posted this at The War Eagle Reader, where you can see the results.)
Thursday, October 8, 2009
Monday, August 31, 2009
Grotus Acorn: now, truly, a blog about vinegar.
I get the feeling sometimes that there are two distinct groups of people who visit this blog. Firstly, there are the folks who are here because they know me in real life and they themselves are awesome. They're mostly here for real-life-ish updates and maybe to see what bizarre thing I'm cooking. Secondly, there are the folks who come to Grotus' Acorn primarily for the football- and Auburn-related posts, IE, folks who get linked up to the blog by Jerry at The Joe Cribbs Car Wash. There are also people like my Dad - well, people who are my Dad - who are here for both.
As you probably already know, The Joe Cribbs Car Wash is officially becoming a part of The War Eagle Reader's new Auburn website. You may also have seen that The War Eagle Reader was looking for writers. Long story cut short - I'll be putting all my Auburn-related blogging eggs in that basket as well. So for the folks who look here for football, look further to The War Eagle Reader. Specifically for the segment titled "God Girl Grill Gridiron." Seek out this logo:

What will remain here? Things I cook, stuff I do at the hospital, and whatever ruminations I have on whatever's to be ruminated upon. It'll be more of a blog per se than it might otherwise have been. Hopefully there will actually be more of the regular-style blogging here, now that I can cordon off all the football and make Grotus' Acorn a more personal endeavor.
Granted, the slogan remains the same because that's who I am: God Girl Grill Gridiron.
War Damn Eagle Forever!
Friday, August 14, 2009
What else is in the teaches of Peaches? Todd is the starter. Huh? Wha?
pretty stunned
I woke up this morning and loaded up my run of sports sites in Firefox. As usual, I end up skipping to THABOTN because Jay's videos auto-play and they start off with that goofy music. "This again," I think to myself. "I'll just shut that off." Thus my day begins: as your body grows bigger, your mind must flower, it's great to learn 'cause knowledge is power! Chris Todd: starting QB despite missing spring drills. Is make joke Jay G. because no funny!
But then I played through the video, in which Kodi gamely answers question after question with no waver in his voice but an expression that says didn't you hear me say I'm going to go pray about this?
Ever to conquer, never to yield.
You have to say this of the guy - and I agree with the Chiznik - he's resilient. Chris Todd is going nowhere until they make him go. Shoulder? Shoulder shmoulder. Mentor ousted mid-season? Still a tiger. Missed spring practice? He'd rather be there for two-a-days anyway. And by God, that kind of persistence is bound to pay off. So my hat's off to him.
I can't speak for his arm, but as I remember - and I can't be bothered to dig up the post at THABOTN - folks have been complaining about him stinging fingers all summer practice. Maybe his shoulder's finally back to it's original, Favre-ian levels. I sure hope so. I really, really hope so.
Stay in school cause it's the best.
In that first moment of incredulity, I was tempted to write something snide and/or panicky. Sure would have been easy. But the fact of the matter is that Franklin heavily favored Todd and has since high school, Mike Leach at one point named him heir to the Red Raider stat sheet, Tuberville let him split reps with our then-heir-apparent, and now Malzahn is also buying in. Franklin, I could dismiss as a Svengali. Tuberville, I could believe he just didn't have his head in the game. Leach, I could contend that he made that decision prior to Todd's shoulder injury. But when Malzahn names Todd the starter after only seeing him in summer ball... there's just got to be something there. Maybe, just maybe, I don't know as much as Malzahn, Leach, and Franklin put together.
So given the consensus of experts, I'm going to consider this issue settled and hold my tongue at least through our first drive versus La-Tech. But just for good measure... at some point last season, we were left with this distinct impression:

By all accounts, the arm is back. Let's put one of those beefy arms back on him for good measure:

Alright now.
Spread Eagle 2009
One thing we know for sure is that this is not going to be a spread a la West Virginia or Florida with the constant threat of a running quarterback. As we discovered almost immediately last season, Chris Todd can't sell the zone read because he can't run fast enough to challenge SEC defenders - the defense chases the tailback because they know they can react to the white boy, and what we end up with is a play-action quarterback draw. With a slow, slow quarterback. The sheer crazy-like-a-fox surprise Todd draw worked a couple times versus LSU, but that won't last long. Todd will get his bell rung and we'll be back to square one minus our anointed starter.
So I expect that while we will be a spread offense, we won't be a Pat White, Tim Tebow, Terrell Pryor, Colin Kaepernick, etc. type of spread offense. We'll spread the field from under center and run out of ace sets or a three-wide I-form. Perhaps picking Todd lends some credence to the coaching staff's insistence that we'll truly be a smash-mouth running team.
Kodi
They're repping him at wideout... How on earth is he going to see the field if he is a freshman-quality wideout in his junior year of college? Even if we were a team that planned to rotate receivers, no one becomes a crisp route-runner overnight. Either Trooper Taylor has been smoke-screening his receivers with his effusions of praise - such that a previously-starting quarterback has a reasonable chance to compete - or Kodi has one year to get better than the guys who've already been doing it for two.
I don't know what's going through his head right now, but if I was recruited as a quarterback, played as a true freshman quarterback, contested for the starting job as quarterback the following year and into the spring and then suddenly was moved out of the backfield entirely, I'd be wondering how valuable I was to the team. Burns reportedly said "I'm mature enough to handle this." To be honest, Kodi, I'm a 26-year-old married doctor and I don't know if I'd be mature enough to handle that.
The other possibility is that Kodi is going to be a wildcat wingback/receiver - basically, a dedicated reverse-passer. In which case, he is now by default competing with Super Mario for touches. If I was either of those guys, I'd be looking at this situation and saying "What the hell?" How is it that two of the most physically gifted players on our team are also its most homeless? Why are we making our gene-pool lotto winners into hobos and then makin' 'em fight? What I think would be most depressing is if one of them wins - the other would be essentially a wasted talent, and wasted time. Especially if Kodi wins: he'd be re-demoted from starting QB to gimmick-in-service-of-the-alabaster-statue. Surely there must be a way to get both of these guys reliable positions. Surely.
I must not know an awful lot. War Damn Eagle.
Saturday, August 8, 2009
Tonight's Menu: chicken soup with tarragon-walnut dumplings

Tonight, the wife is post-call and exhausted. It's always good to have a hearty, rib-sticking sort of meal when you're post-call. So, I'm making chicken and dumplings.
My recipe is a little bit different from the norm, though. For the chicken, I use boneless chicken thighs. These little beauties give you all the dark flavor of the thigh meat - so much better than a measly old chicken breast - without all the bones. And they're cheap! Can't beat that. I heat up a little oil in a large Dutch oven and brown them lightly on both sides. When they're done, I take them out of the pan and add a mirepoix, deglazing with a little white wine or vermouth. Once the vegetables are soft (but not brown) the chicken gets cut up morsels and returned to the pot with its juices. The whole mixture gets covered generously with chicken stock and is brought to a boil, and in go the dumplings. Once they float and look puffy on both sides, dinner is ready.
The dumplings are my favorite part of making this meal. While I use Bisquick just for the speed of things, I like to dress 'em up with some finely chopped tarragon. That soft, anise-like flavor is a pretty classic-French with chicken. For today's batch, I tried something new: walnut. Tarragon and walnut go together pretty well in a variety of recipes, so I thought why not my dumplings? I took some chopped walnuts and ground them up in my spice/coffee grinder, and worked them into the Bisquick with the tarragon before adding the milk. I'd expect that they'll float a little more easily than regular dumplings because of the fattiness from the walnuts - I made butter-recipe dumplings once and they didn't even sink into the soup. But they smell fantastic.
I've got the mirepoix chopped, the chicken thawed, and the dumpling dough made, all resting in the fridge for tonight's meal. We'll either have a sweet red table wine we bought on our honeymoon, or a Riesling I picked up at the store today.
Thursday, July 16, 2009
Burns-shirting
First off, credit where credit is due: it has been remarkably bearable offseason, and that's in large part (for me) due to The Joe Cribbs Car Wash. I've wanted to write about Auburn football, and I've tried, but my posts always go something like this: "What Jerry said."
That said, I couldn't disagree more with the latest post on Tyrik Rollison and the possibility of burning his redshirt. I think it would be a huge mistake.

It's probably true that Tyrik Rollison fresh out of highschool is a more polished QB than was Kodi Burns right out of highschool. Sure, 73% completion rate is nothing to sneeze at, and a mobile quarterback (I think) has to lean on his accuracy. But in no way does that mean that Rollison can afford to just give up a redshirt year of learning. Decision-making and command of the offense are the QB's first and most important job - even before throwing the ball - and Auburn has failed in great part due to lack of not physical talent, but this sort of leadership. Sacrificing leadership for raw talent is exactly the same mistake we made in 2007 with Kodi vs. Brandon. Most of the time, the defense would be in good coverage of the handful of pass plays Kodi could execute, or he would not find his open man and would just run. If he ever displayed his inaccuracy, it was on the rare occasion that he had the opportunity to pass and actually took it. He wasn't in true command of the offense, and that - not his inaccuracy - hamstrung him. It doesn't matter if Rollison can throw a football through a moving moon pie from eighty yards away if he throws the ball to the wrong receiver, if he can only run two plays, or if he takes off downfield because he can't find the open man.
Moreover, the more we can get out of Rollison the better. If he's as much the awesome prospect as he's made out to be, I give him three years of playing time before the NFL comes callin'. Do we want one of those three years to be 2009, when we're breaking him in and teaching him on-the-fly to run a complex offense in front of TV cameras and tens of thousands of roaring fans? 2009, when our entire program is picking its way through the wreckage? If Rollison plays this year as a true freshman, something will slip through the cracks and we will basically lose one of his years.
And for what? I would agree that Chizik can't afford to waste time, but neither can he afford to be tyrannized by the urgent. The plain fact of the matter is that this is not a reloading year, not even a rebuilding year, but a total-overhauling year and we need to temper our expectations. It is simply not reasonable to expect Auburn to win now, having just fired an entire coaching staff, with at least a three-way QB race and a dearth of receivers. It's not happening. Period. Auburn will wait, because it must. And I think it's a little much to suggest, as Jerry does, that a bad season followed by a rebuilding year will cement our SEC afterthought status. This just isn't borne out by history, distant or recent. For one example I have two words: Doug Barfield. For two, think back to the end of the Terry Bowden era: having gone 10-3 just the year before, the 1998 Auburn squad posted an abysmal 3-8 record. The year after that, we went 5-6 in Tuberville's first year as a coach. And somehow - SEC afterthought though we were - by late 2002, Auburn was in everyone's preseason top five. We were actually in worse shape in summer 1999 than we are now, and it took us a whopping three years to build the 2004 juggernaut*. We are Auburn, and we will always be Auburn. The idea that we have to win right away or all is lost is just not true.
So in my humble opinion, to burn Rollison's redshirt would be a fatal error: we would be sacrificing the long-term health of our program in order to provide a tenuous-at-best solution to a problem that doesn't exist. Leave Tyrik Rollison alone.
Speaking of Chizik's record: even if we go undefeated including the SECCG and a bowl, Chizik will still not be a winning coach at the end of this season. Whatever albatross his record may be, it will still swing from his neck come February. But I don't think it is such a weight. If the Auburn administration had wanted a coach with a winning record, quite frankly they would have hired one. I think that in Chizik, they saw a guy who will lose now with his horde of Cyclone freshmen so that he can win later with his horde of Cyclone juniors. A guy who will take a pay cut to get the best assistants he can find. A guy willing to take his short-term licks so that he can land the haymaker when it counts, and that's exactly the kind of man we need on the Plains.
War Damn Eagle.
* I should probably be more careful about pointing this out, but the key ingredients in our rise to 04 glory seemed to be a brilliant offensive coordinator, a bumper crop of tailbacks and a stud QB. Hmm...
Wednesday, June 10, 2009
Gridiron Skew Part 1
Something you have already guessed: your humble blogger is a bit of a nerd. And, I really nerd out on football. It is a great sporting frontier of obstinate complexity. Twenty-two men with different, overlapping and constantly fluctuating jobs operate from a multitude of formations on a field that, conceptually, is massive, continental, vast. This is no pitcher-vs-batter game, is not even as simple as basketball. Football is to other sports as chess is to checkers.
So naturally, it's exciting to an amateur mathnerd like myself to see that folks out there on the intertubes are trying to make sense of the pile of data generated by each single football game. Granted, some of this is of the "We calculate this metric from a privileged position" variety, or baldly dismissive of core mathematical concepts1. But Chris Brown of Smart Football really digs up some gems, and he's more than willing to tantalize us with his methods. He talks about game theory and its application to run/pass balance. He mentions the Sharpe ratio when evaluating the effectiveness of a play. Every step wrings a little more heuristics out of the great game. This, my friends, is awesome.
For instance, the aforementioned Sharpe ratio. As Chris puts it:
This is all well and good. What's more, the Sharpe ratio may be used to determine the ratio with which you use one strategy (or one play) over another. If one play's Sharpe ratio is 2 and the other play's Sharpe ratio is 4, you should use the latter play twice as often as the former. The power of this method is clear when you begin sectioning your data ever more finely - the Sharpe ratio allows us to compare any number of situations. How do your different running plays fare on second down and less than five yards? Out of which formation is play-action most effective? At what position on the field is your offense most able to run the HB draw to the near side out of a pro set in the fourth quarter on third down with more than four yards to go? With enough data, the Sharpe ratio can help you answer that question.
However, the Sharpe ratio is weak in a critical aspect: it punishes inconsistency. Why is that a weakness? Take, for example, the first pass play postulated: absolute, robotic 10 yards per attempt. Sounds like a great play. What could be better, though, is a play that results in a 20 yard gain every fourth attempt (10, 10, 10, 20.) It's clear to everyone and their blind, demented uncle that 10, 10, 10, 20 is better than 10, 10, 10, 10. And yet, the Sharpe ratio is misleading. Because we divide by standard deviation, a play's inconsistency - whether the play succeeds wildly or fails miserably - is punished. Essentially, when you calculate the Sharpe ratio, you are implicitly assuming that an offensive big play and a defensive big play are equally horrible. This weakness becomes especially clear when one starts adjusting yardage totals for touchdowns and turnovers. A helpful guy out on the interwebs has run the calculations: a touchdown or a turnover is basically equivalent to 50 yards. But if your goal line play wins you a touchdown every fourth attempt - certainly an effective play - that's 1, 1, 1, and 51. Standard deviation is so high that it will obliterate your statistical decision-making.
I'm picking on the Sharpe ratio because its promises are so tantalizing, and yet I think it asks the wrong question. What we should be ascertaining is the level of skew in the yards gained by each play. Aside perhaps from Jim Tressel, coaches value big-play capability just as much as they dread the defense's ability to ram a big play down their throat. We all want our teams to be explosive. Just, explosive in the downfield direction. To put it in the terms of the shape of a distribution, we want the yards-per-play distribution to have a negative skew, like so (via): Skew answers the question, does a play regularly succeed? If there is negative skew, the answer is yes. So how do we reward negative skew in our analyses?
I should probably put the rest in another post...
1. Direct quote:
So naturally, it's exciting to an amateur mathnerd like myself to see that folks out there on the intertubes are trying to make sense of the pile of data generated by each single football game. Granted, some of this is of the "We calculate this metric from a privileged position" variety, or baldly dismissive of core mathematical concepts1. But Chris Brown of Smart Football really digs up some gems, and he's more than willing to tantalize us with his methods. He talks about game theory and its application to run/pass balance. He mentions the Sharpe ratio when evaluating the effectiveness of a play. Every step wrings a little more heuristics out of the great game. This, my friends, is awesome.
For instance, the aforementioned Sharpe ratio. As Chris puts it:
The Sharpe Ratio is defined as the ratio of the difference between the expected return of some strategy minus the expected return of some riskless benchmark and the standard deviation of the strategy.[ed: This can be written as such for those of us who like equations]Standard deviation is a measurement of the volatility of a set of values. You can read more about standard deviation here. For example, if a given pass play was run four times, and the results (in yards) of the play was 10, 10, 10, and 10, it has a standard deviation of 0. However, if it was run four times and the results were 0, 0, 40, and 0, it has the same average gain (10 yards) but its standard deviation would be 20. We would prefer pass play one to pass play two. It has the same expected gain, but it is less risky than the second.

This is all well and good. What's more, the Sharpe ratio may be used to determine the ratio with which you use one strategy (or one play) over another. If one play's Sharpe ratio is 2 and the other play's Sharpe ratio is 4, you should use the latter play twice as often as the former. The power of this method is clear when you begin sectioning your data ever more finely - the Sharpe ratio allows us to compare any number of situations. How do your different running plays fare on second down and less than five yards? Out of which formation is play-action most effective? At what position on the field is your offense most able to run the HB draw to the near side out of a pro set in the fourth quarter on third down with more than four yards to go? With enough data, the Sharpe ratio can help you answer that question.
However, the Sharpe ratio is weak in a critical aspect: it punishes inconsistency. Why is that a weakness? Take, for example, the first pass play postulated: absolute, robotic 10 yards per attempt. Sounds like a great play. What could be better, though, is a play that results in a 20 yard gain every fourth attempt (10, 10, 10, 20.) It's clear to everyone and their blind, demented uncle that 10, 10, 10, 20 is better than 10, 10, 10, 10. And yet, the Sharpe ratio is misleading. Because we divide by standard deviation, a play's inconsistency - whether the play succeeds wildly or fails miserably - is punished. Essentially, when you calculate the Sharpe ratio, you are implicitly assuming that an offensive big play and a defensive big play are equally horrible. This weakness becomes especially clear when one starts adjusting yardage totals for touchdowns and turnovers. A helpful guy out on the interwebs has run the calculations: a touchdown or a turnover is basically equivalent to 50 yards. But if your goal line play wins you a touchdown every fourth attempt - certainly an effective play - that's 1, 1, 1, and 51. Standard deviation is so high that it will obliterate your statistical decision-making.
I'm picking on the Sharpe ratio because its promises are so tantalizing, and yet I think it asks the wrong question. What we should be ascertaining is the level of skew in the yards gained by each play. Aside perhaps from Jim Tressel, coaches value big-play capability just as much as they dread the defense's ability to ram a big play down their throat. We all want our teams to be explosive. Just, explosive in the downfield direction. To put it in the terms of the shape of a distribution, we want the yards-per-play distribution to have a negative skew, like so (via):
 Skew answers the question, does a play regularly succeed? If there is negative skew, the answer is yes. So how do we reward negative skew in our analyses?
I should probably put the rest in another post...
1. Direct quote:
I do agree ... that R-squared gives you "the proportion of variance that is in common between NBA team payroll and NBA team performance." But what does that mean? Almost nothing, unless you're a statistician.Similarly, one could declare that "I do agree that USC hammered the seams in Penn State's overmatched cover 3 defense, but what does that mean? Almost nothing, unless you're talking about football." May as well come out and say "I don't understand how to use this metric but I'm going to criticize it."
Friday, May 15, 2009
Monopoly Properties
Edit: WIFE! WIFE! WIFE!
Recently, I was playing Monopoly with my darling wife. The first game, I got lucky and bought all four railroads and the orange set of properties. I leveraged everything for hotels and won that game handily. But the second game brought the nightmare scenario: all properties purchased, no monopolies.
Rather than restart the game, we began bargaining. I resolved to hold firm until I got a deal that favored my cause - don't look at me like that, she's more competitive than I - and rejected a couple of her trades right off the bat. But then, she offered me one I couldn't pass up. I had two out of three green squares (heretofore my favorite properties) and two out of three red squares. She had two out of three yellow squares. Her proposal: trade her the last yellow property and one of the reds for the last green. I eagerly accepted, again mortgaged everything to buy houses... and got completely hosed. I looked at her yellow properties - three hotels - and looked at my greens, with three or four houses apiece. Needless to say, successfully running that gauntlet was never going to happen. Now this was remarkable - the orange properties clearly annihilated the a block of properties three full blocks ahead of them. Clearly, there was some hidden pattern that one could exploit in a trade. Of course, my nerd-sense was piqued. "I can feel an Excel spreadsheet coming on..." I said. She just shook her head.
BTW: I'm just a single nerd. Any nerds who want to CMIIW, well, I'll buy you a Coke.
Here's the board in question:

Property cost increases in a fairly continuous manner as one travels around the board. If we exclude the purples and the dark blues, cost of property begins at $100 and increases by $20 every time the last or first property in a block is reached. Likewise, house cost increases stepwise by $50, with the first flight of properties requiring $50 per house, the second requiring $100, the third requiring $150, and the fourth requiring $200.

Taking them together, we can plot the cost of attaining the different states (0 houses, 1 house, 2 houses...) for each property:

One can already see that the two twin-property blocks (purples and dark blues) don't fit the trend - they are simply too cheap to develop because you only have to buy two of them to start building houses. This is obvious, of course. What I hadn't expected was that price would peak at the green properties - Boardwalk and Park Place require a slightly larger initial investment per-property, but are still cheaper to develop than their preceding neighbors. The green properties are the most expensive to develop on the entire board.
Rent increases in a continuous yet idiosyncratic manner:

Trends are less illuminating here. We notice the gradual increase from left-to-right, and the fact that no single property charges less rent than any property before it. But other than that, there doesn't seem to be any unifying trend. The behavior in the mauve block is particularly weird, and again, the twin-property blocks are outliers.
But how do those trends interact? Monopoly's nut and bolts are proper investment - therefore, one should form a trading strategy that maximizes return on investment. Of course it's true that merely breaking even on a property does not mean you've bankrupted your opponent. However, breaking even does mean that you've spent less money on that property than your opponent - the soul of good development. So I figured one could roughly model a property's success rate by calculating the probability that the greedy landlord will recoup their initial ante.
First, we must calculate the ratio of rent to investment. For a single, naked property, that would be the rent you collect divided by the purchase cost of that property:

A visually-pleasing color-coded version, you say? Voila:

Another trend becomes evident: the first block of properties in a flight is less efficient than the second block. You pay the same for a house in the red block as you do in the yellow block, but you get less rent out of it. Thus, while no property charges less rent than any property before it, some properties charge less rent per dollar invested than some properties before them. IE, they have a lower . Also, it's important to see that the first half of the board already seems much more efficient than the second half, per-land. This is pretty critical. And lastly, it is interesting to note that efficiency has an S-curve, reaching a peak derivative at the third stage of property development. increases slightly on adding the first house, moreso with the second house, increases the most dramatically with the third house, and there are diminishing returns from then on.
From we can calculate the number of times the property must be landed upon in order to fully recoup the investment:
This number is useful when we consider the probability of landing on each property. It is conceivably possible to calculate the probability of landing on each property based on its position - I don't know how to do that. Lucky for us, a helpful guy out on the interwebs has done just that:

Note: he's approached the game differently than I. Take that as you will.
He has determined the probabilities based on two different game strategies. The "short" strategy is an early-game strategy in which players pay to get out of jail as quickly as possible, so to buy up property. The "long" strategy is a late-game strategy in which players stay in jail as long as possible, so to avoid paying rent. This strategy increases the probability of being in jail a little less than three-fold, which we would expect - players may stay in jail until they pay, roll doubles, or three turns have passed at which time they must pay $50 and leave. For the regular properties, this means the probability of landing on any property space is somewhat decreased. There are some weirdnesses associated with that, but I'm really not qualified to discuss them.
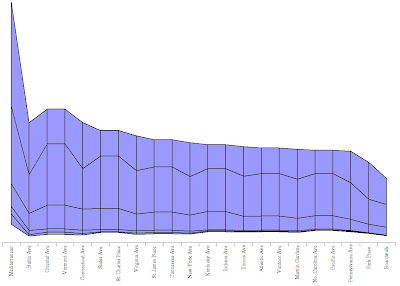
First, notice the random peaks at Illinois, New York, Boardwalk, and St. Charles. You can be sent to all three of these properties directly by chance cards. New York is a lesser peak because its card is "Go Back Three Spaces" which has different effects based on which of three chance locations you have landed on. You can also be sent to Go, Reading Railroad, or to Jail by cards (or by the Go To Jail square.) All of this tends to weight the front half of the board much more heavily in terms of probability. Essentially, the probability peaks around free parking (though this doesn't explain why I never land on free parking and my wife always does. Go figure.) This shows us that while the earlier properties may not draw as much rent, you do land on them more often.
So how do those two trends (required lands and probability of a single land) interact? Now that we know the probability of landing on each square and we know the required number of landings to recoup investment, it is simple to calculate the probability of breaking even. If a certain event has a probability A, the probability of that event occurring B number of times is A^B. So, the probability of recouping an investment in a single Monopoly property by landing only on that property is:
A graph of that is pretty interesting. Here are two graphs, for "short" and "long" strategies respectively:


First off, I know what everyone is already thinking: Park Place/Boardwalk appear bizarrely awesome, total outliers. Likewise, Mediterranean Avenue and Baltic Avenue appear absolutely worthless. Within the middle eighteen properties, where a strong trading strategy is less immediately intuitive, the function clearly points to a sweet spot around the mauve properties. In particular, it points to the light blue properties - somewhat of a surprise. If Monopoly was the Houston Rockets, then Connecticut Avenue would appear to be Shane Battier.
But that still doesn't tell us everything. After all, one does not buy single properties in Monopoly. One buys streets, the success of which is dependent upon the success of all two or three properties therein. Calculating the successfulness of each block is a little trickier. If you're a math geek and I've made an error somewhere, step in. Here's my approach. What we need first is the rent which we are likely to be charged if we land within a certain block. This is not the simple arithmetic mean of the rents being charged on all three properties. If Baltic charges $1,000 and Mediterranean charges $1, the arithmetic mean is $500.50. But if Baltic gets a land 1% of the time and Mediterranean gets the remaining 99%, the true likely rent value is much closer to $1. We really need to model the land as two events: landing on a certain block, and landing on a particular square within the block. The process is akin to a current divider, or partial pressures in chemistry. If a player lands within a certain block, the probability he will land on a certain square is the independent probability of landing on that square divided by the probability of landing on any square in that block (the sum of the probabilities.) We can then multiply the resultant probabilities by their corresponding rents, and add these together to get a probability-adjusted rent for the entire block:

Note: in this calculation I've assumed that all three properties would have the same number of houses. I may have some time on my hands, but I don't have the kind of time I'd need to calculate all 4,032 combinations.
Investment, likewise, was calculated by summing the costs of all three properties, plus the cost of all the houses:

Rent/investment ratio is calculated as before, but with the adjusted values:

And of course, the charismatic colored version:

And again we graph the reciprocal, which shows us the number of lands necessary to recoup investment. Nothing new here, there is an abrupt dip at the orange block:

Broadway's grip is slowly weakening...
For the calculation of whole-block probabilites, the value used for probability is the sum of the probabilities of the squares within each block. Compared to the earlier graph of probability (which is somewhat of a mess) this one is exceedingly clear. Probability peaks somewhere around free parking:

Using these recalculated values, probability of recouping investment is calculated as before


And it's rather profound. The orange properties are easily the best on the board - even better than the vaunted Broadway and Park Place. And my beloved green properties? Nasty, nasty bad. The maximum probability of recouping your investment on the greens is 0.0004, or 1 in 2500. Comparatively, the maximum for the orange properties is 0.05, or 1 in 20. This does not mean that buying and developing the orange properties will bankrupt your opponent automatically - the greens obviously have more "killing power" per land. However, they get landed upon so infrequently and are so expensive to develop, you hurt yourself far more than your opponent.
Recently, I was playing Monopoly with my darling wife. The first game, I got lucky and bought all four railroads and the orange set of properties. I leveraged everything for hotels and won that game handily. But the second game brought the nightmare scenario: all properties purchased, no monopolies.
Rather than restart the game, we began bargaining. I resolved to hold firm until I got a deal that favored my cause - don't look at me like that, she's more competitive than I - and rejected a couple of her trades right off the bat. But then, she offered me one I couldn't pass up. I had two out of three green squares (heretofore my favorite properties) and two out of three red squares. She had two out of three yellow squares. Her proposal: trade her the last yellow property and one of the reds for the last green. I eagerly accepted, again mortgaged everything to buy houses... and got completely hosed. I looked at her yellow properties - three hotels - and looked at my greens, with three or four houses apiece. Needless to say, successfully running that gauntlet was never going to happen.
 Now this was remarkable - the orange properties clearly annihilated the a block of properties three full blocks ahead of them. Clearly, there was some hidden pattern that one could exploit in a trade. Of course, my nerd-sense was piqued. "I can feel an Excel spreadsheet coming on..." I said. She just shook her head.
BTW: I'm just a single nerd. Any nerds who want to CMIIW, well, I'll buy you a Coke.
Here's the board in question:

Property cost increases in a fairly continuous manner as one travels around the board. If we exclude the purples and the dark blues, cost of property begins at $100 and increases by $20 every time the last or first property in a block is reached. Likewise, house cost increases stepwise by $50, with the first flight of properties requiring $50 per house, the second requiring $100, the third requiring $150, and the fourth requiring $200.

Taking them together, we can plot the cost of attaining the different states (0 houses, 1 house, 2 houses...) for each property:

One can already see that the two twin-property blocks (purples and dark blues) don't fit the trend - they are simply too cheap to develop because you only have to buy two of them to start building houses. This is obvious, of course. What I hadn't expected was that price would peak at the green properties - Boardwalk and Park Place require a slightly larger initial investment per-property, but are still cheaper to develop than their preceding neighbors. The green properties are the most expensive to develop on the entire board.
Rent increases in a continuous yet idiosyncratic manner:

Trends are less illuminating here. We notice the gradual increase from left-to-right, and the fact that no single property charges less rent than any property before it. But other than that, there doesn't seem to be any unifying trend. The behavior in the mauve block is particularly weird, and again, the twin-property blocks are outliers.
But how do those trends interact? Monopoly's nut and bolts are proper investment - therefore, one should form a trading strategy that maximizes return on investment. Of course it's true that merely breaking even on a property does not mean you've bankrupted your opponent. However, breaking even does mean that you've spent less money on that property than your opponent - the soul of good development. So I figured one could roughly model a property's success rate by calculating the probability that the greedy landlord will recoup their initial ante.
First, we must calculate the ratio of rent to investment. For a single, naked property, that would be the rent you collect divided by the purchase cost of that property:
and for a property with houses:

This number shows us how much money one gets in rent as a percentage of the money you invested into the property - the efficiency of investment. I calculated this number for all states of the property (zero houses, one house, two houses, etc.):


A visually-pleasing color-coded version, you say? Voila:

Another trend becomes evident: the first block of properties in a flight is less efficient than the second block. You pay the same for a house in the red block as you do in the yellow block, but you get less rent out of it. Thus, while no property charges less rent than any property before it, some properties charge less rent per dollar invested than some properties before them. IE, they have a lower
. Also, it's important to see that the first half of the board already seems much more efficient than the second half, per-land. This is pretty critical. And lastly, it is interesting to note that efficiency has an S-curve, reaching a peak derivative at the third stage of property development. increases slightly on adding the first house, moreso with the second house, increases the most dramatically with the third house, and there are diminishing returns from then on.From
we can calculate the number of times the property must be landed upon in order to fully recoup the investment:Pretty simple. The number of times one must land on the property is the number of times that the rent goes into the investment:


This number is useful when we consider the probability of landing on each property. It is conceivably possible to calculate the probability of landing on each property based on its position - I don't know how to do that. Lucky for us, a helpful guy out on the interwebs has done just that:

Note: he's approached the game differently than I. Take that as you will.
He has determined the probabilities based on two different game strategies. The "short" strategy is an early-game strategy in which players pay to get out of jail as quickly as possible, so to buy up property. The "long" strategy is a late-game strategy in which players stay in jail as long as possible, so to avoid paying rent. This strategy increases the probability of being in jail a little less than three-fold, which we would expect - players may stay in jail until they pay, roll doubles, or three turns have passed at which time they must pay $50 and leave. For the regular properties, this means the probability of landing on any property space is somewhat decreased. There are some weirdnesses associated with that, but I'm really not qualified to discuss them.
First, notice the random peaks at Illinois, New York, Boardwalk, and St. Charles. You can be sent to all three of these properties directly by chance cards. New York is a lesser peak because its card is "Go Back Three Spaces" which has different effects based on which of three chance locations you have landed on. You can also be sent to Go, Reading Railroad, or to Jail by cards (or by the Go To Jail square.) All of this tends to weight the front half of the board much more heavily in terms of probability. Essentially, the probability peaks around free parking (though this doesn't explain why I never land on free parking and my wife always does. Go figure.) This shows us that while the earlier properties may not draw as much rent, you do land on them more often.
So how do those two trends (required lands and probability of a single land) interact? Now that we know the probability of landing on each square and we know the required number of landings to recoup investment, it is simple to calculate the probability of breaking even. If a certain event has a probability A, the probability of that event occurring B number of times is A^B. So, the probability of recouping an investment in a single Monopoly property by landing only on that property is:

A graph of that is pretty interesting. Here are two graphs, for "short" and "long" strategies respectively:


First off, I know what everyone is already thinking: Park Place/Boardwalk appear bizarrely awesome, total outliers. Likewise, Mediterranean Avenue and Baltic Avenue appear absolutely worthless. Within the middle eighteen properties, where a strong trading strategy is less immediately intuitive, the function clearly points to a sweet spot around the mauve properties. In particular, it points to the light blue properties - somewhat of a surprise. If Monopoly was the Houston Rockets, then Connecticut Avenue would appear to be Shane Battier.
But that still doesn't tell us everything. After all, one does not buy single properties in Monopoly. One buys streets, the success of which is dependent upon the success of all two or three properties therein. Calculating the successfulness of each block is a little trickier. If you're a math geek and I've made an error somewhere, step in. Here's my approach. What we need first is the rent which we are likely to be charged if we land within a certain block. This is not the simple arithmetic mean of the rents being charged on all three properties. If Baltic charges $1,000 and Mediterranean charges $1, the arithmetic mean is $500.50. But if Baltic gets a land 1% of the time and Mediterranean gets the remaining 99%, the true likely rent value is much closer to $1. We really need to model the land as two events: landing on a certain block, and landing on a particular square within the block. The process is akin to a current divider, or partial pressures in chemistry. If a player lands within a certain block, the probability he will land on a certain square is the independent probability of landing on that square divided by the probability of landing on any square in that block (the sum of the probabilities.) We can then multiply the resultant probabilities by their corresponding rents, and add these together to get a probability-adjusted rent for the entire block:
And the graph thereof:= probability of landing on a particular property (n) in the block
= probability of landing on one of those properties (IE, sum of the probabilities)
= the rent charged by that property (n) with a certain number of houses (h)


Note: in this calculation I've assumed that all three properties would have the same number of houses. I may have some time on my hands, but I don't have the kind of time I'd need to calculate all 4,032 combinations.
Investment, likewise, was calculated by summing the costs of all three properties, plus the cost of all the houses:

Rent/investment ratio is calculated as before, but with the adjusted values:

And of course, the charismatic colored version:

And again we graph the reciprocal, which shows us the number of lands necessary to recoup investment. Nothing new here, there is an abrupt dip at the orange block:

Broadway's grip is slowly weakening...
For the calculation of whole-block probabilites, the value used for probability is the sum of the probabilities of the squares within each block. Compared to the earlier graph of probability (which is somewhat of a mess) this one is exceedingly clear. Probability peaks somewhere around free parking:

Using these recalculated values, probability of recouping investment is calculated as before
...giving us this graph:


And it's rather profound. The orange properties are easily the best on the board - even better than the vaunted Broadway and Park Place. And my beloved green properties? Nasty, nasty bad. The maximum probability of recouping your investment on the greens is 0.0004, or 1 in 2500. Comparatively, the maximum for the orange properties is 0.05, or 1 in 20. This does not mean that buying and developing the orange properties will bankrupt your opponent automatically - the greens obviously have more "killing power" per land. However, they get landed upon so infrequently and are so expensive to develop, you hurt yourself far more than your opponent.
Subscribe to:
Comments (Atom)
